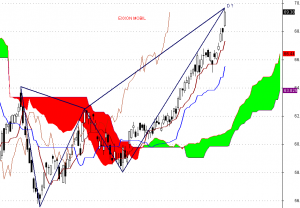
Exxon Mobil – technical Ichimoku Kinko Hyo Analysis & geometry reversal pattern?
Posted by Marek | Posted in English, Markets review, Stocks | Posted on 05-11-2010 9:57 am
4
Today we will try to find sth. on the chart of the Exxon Mobil Corporation. One of the largest publicly traded companies in the world.
The Ichimoku sentiment is definitely bullish. All buy signals have happened in the last few months.
On the other hand on the chart we can notice the bearish Butterfly Pattern. This is the one of the strong harmonic patterns which signals the trend reversal. In this fact we have to be more cautious than usual. When sell signal come the bears attack can lower prices more that 10 percent.


A co to za posty in inglisz i to jeszcze na hamerykańskich spółkach? 🙂 czyżby polecasz swoją stronę gdzieś do juesej?:)
Jest trochę wizyt z USA dlatego co jakiś czas będę pisał po angielsku 😉
No i u nas nie widzę już fajnych wejść. W ubiegłym roku było ich bardzo dużo. W pierwszej połowie tego roku, też bardzo ładnie można było grać. Obecnie nic w miarę wiarygodnego nie widzę. Dlatego z przymusu trzeba robić ekspansję na inne rynki. Na NYSE jest tyle spółek, że zawsze się znajdzie jakaś ciekawa do gry 😉
Marku, w którym biurze maklerskim oferowany jest dostęp do giełdy NYSE? Jakiej platformy używasz?
Tutaj znajdziesz odpowiedź 🙂 Aczkolwiek to jeszcze nie jest szczyt marzeń 😉
http://www.fio.pl/akcje-inwestycje/porownanie-prowizji-brokerow