Exxon Mobil – technical Ichimoku Kinko Hyo Analysis & geometry reversal pattern?
Posted by Marek | Posted in English, Markets review, Stocks | Posted on 05-11-2010 9:57 am
4
Today we will try to find sth. on the chart of the Exxon Mobil Corporation. One of the largest publicly traded companies in the world.
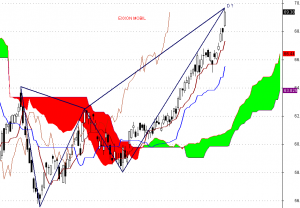
The Ichimoku sentiment is definitely bullish. All buy signals have happened in the last few months.
On the other hand on the chart we can notice the bearish Butterfly Pattern. This is the one of the strong harmonic patterns which signals the trend reversal. In this fact we have to be more cautious than usual. When sell signal come the bears attack can lower prices more that 10 percent.


