Posted by Marek | Posted in akcje, Stocks | Posted on 12-12-2010 9:43 pm
3

BP
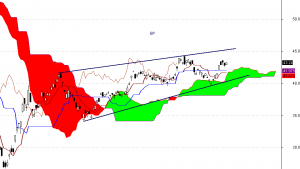
Spółka wybiła linię wsparcia, po czym nastąpił spadek rzędu kilku dolarów. Zatrzymał się on jednak, ostatniego dnia listopada, w nieprzypadkowym rejonie cenowym. Obecnie traktuję go zatem jako korektę ruchu wzrostowego.
Dopiero trwałe zejście poniżej 39,5$ będzie sygnałem słabości dla tego waloru. Możliwa jest wtedy przecena większej skali.
Posted by Marek | Posted in English, Markets review, Stocks | Posted on 05-11-2010 9:57 am
4

Exxon Mobil
Today we will try to find sth. on the chart of the Exxon Mobil Corporation. One of the largest publicly traded companies in the world.
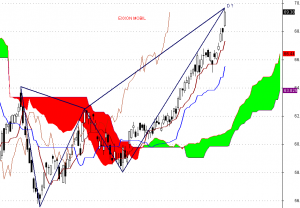
The Ichimoku sentiment is definitely bullish. All buy signals have happened in the last few months.
On the other hand on the chart we can notice the bearish Butterfly Pattern. This is the one of the strong harmonic patterns which signals the trend reversal. In this fact we have to be more cautious than usual. When sell signal come the bears attack can lower prices more that 10 percent.


